Cannabis Analytics can be yielded as one of the most powerful tools in our industry, especially if it can help partners make more impactful decisions about their product assortment, sales, and collections. Nabis Analytics aims to do just that—this dynamic dashboard provides real-time data that allow brands and retailers alike to leverage specific metrics and unlock future strategies powered by data-driven insights.
How Our Analytics Dashboard Works
The Nabis Analytics Dashboard organizes your portfolio, product, and sales team performances into six different categories: Retail Customers, Orders, AR & Terms, Products, Sales, and Locations. The purpose of these consolidated metrics is to provide brands with the best information about how to make strategic decisions and measure the results across their business as it relates to current accounts, product line-up, and market saturation.
Retailers
The Retailers tab overviews a month-to-month breakdown and trends of account performances.
.png)
Orders
The Orders tab breaks down weekly, monthly, and future orders that can be further segmented by applying a date range.

AR & Terms
The AR & Terms dashboard displays outstanding accounts receivable and what’s been collected so far.

Products
The Products tab features a performance evaluation of how many units per SKU have sold within a selected date range and what products are making up the majority of sales.

Sales
The Sales tab overviews your sales reps’ performances and details the number of orders they’ve submitted, how many accounts they’re managing, their term decisions, their discounting behavior, and how much they’ve shipped.

Locations
Under this Locations tab, there’s a geo-heat map that displays overall market saturation city-by-city.

Real-Time Data For Retailers
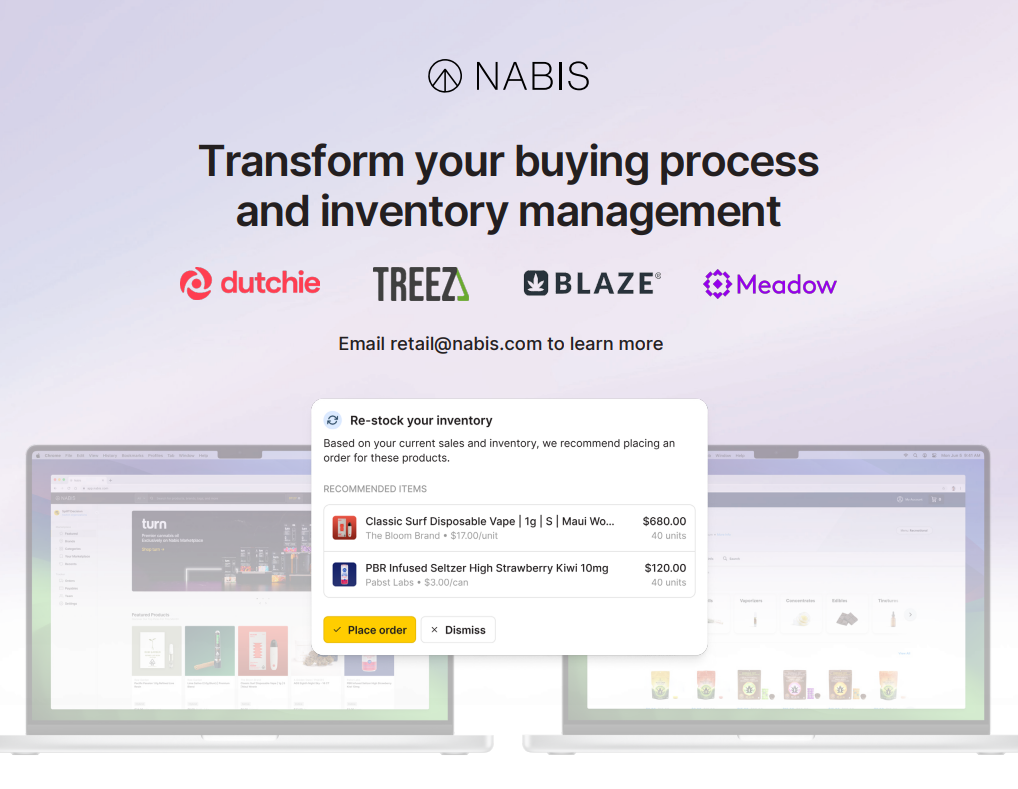
On the retailer-facing dashboard accessible through Nabis Tracker, retail buyers can check out their purchasing performance, ordering behavior, and most ordered brands. This dashboard also provides visibility into their AR, future orders to be delivered, every invoice, and their corresponding COAs. Nabis Tracker also allows for quick re-orders to avoid any empty shelves.
Strategies Powered By Data-driven Insights
With Nabis Analytics, brands and retailers alike can unlock valuable insights into key areas of their business. With a focus on metrics related to sales performances, AR collections, product assortment, and market saturation, the Nabis Analytics Dashboard is the perfect solution for partners looking to leverage their wholesale cannabis data in a way that empowers them to make more informed decisions about their businesses.

.png)